You can check if the workload of your different Sections is correctly “balanced”, by looking at the MSWindows “Task Manager”.
To run the MSWindows “Task Manager”, right-click the MSWindows Taskbar and select “Start Task Manager”:

The MSWindows “Task Manager” appears. You can see the number of cores (i.e. this is more or less equivalent to the number of CPU’s) here:
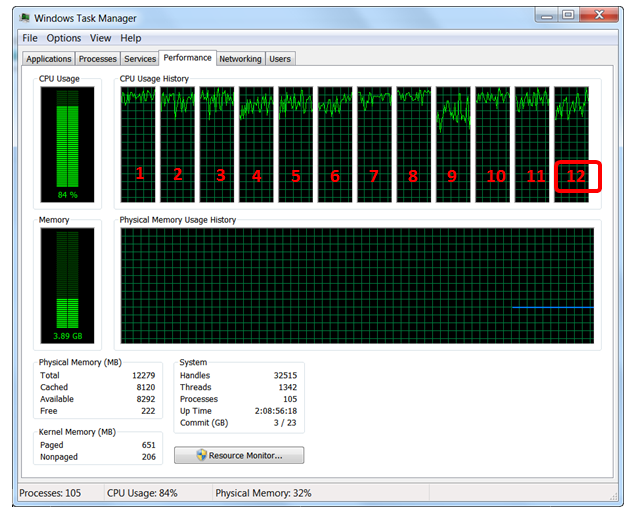
You can see that, on this example, there are 12 cores (i.e. this is more or less equivalent to 12 CPU’s).
You can estimate how much CPU a running Anatella Graph is using: On a 12-core system:
When Anatella fully uses 1 CPU, the “CPU” column displays 8 % (≈1x100/12).
When Anatella fully uses 2 CPU’s, the “CPU” column displays 16 % (≈2x100/12).
When Anatella fully uses 3 CPU’s, the “CPU” column displays 25 % (≈3x100/12).
When Anatella fully uses 4 CPU’s, the “CPU” column displays 33 % (≈4x100/12).
When Anatella fully uses 5 CPU’s, the “CPU” column displays 41 % (≈5x100/12).
Etc.
If your Anatella graph is designed to use 4 CPU’s, then the “CPU” column inside the MSWindows “Task Manager” should display 33% (on a computer that has 12 cores). If that’s not the case (e.g. you get 12%), it means that some Multithread Sections are “starving” and you are not completely using your 4 CPU’s. Maybe you should re-design your Anatella graph to balance in another way the computation workload to better use your 4 CPU’s.
You should also try to avoid using more CPU’s than the than the real physical amount of CPU’s inside your server because, in this situation, MSWindows must “emulate” by software the missing CPU’s and this leads to a very large speed drop: You’ll have “pipeline stall” and “starving” everywhere. For example: you have a 4 CPU server and your Anatella graph is designed to use 7 CPU’s: This is bad: Your data-transformation will run in very inefficient way: Try decreasing the number of CPU used inside your graph.
The “emulation” of many CPU’s involves a procedure named “context switching”: For example, when you emulate two 2 *virtual* CPU’s using one *real* CPU’s, what you are actually doing is:
a)Use your (only)*real* CPU for a few milliseconds to execute the computation that the first *virtual* CPU must do.
b)Save the “state” of the computation assigned to the first *virtual* CPU (A “state” typically includes the content of all CPU registers and a reset of the micro-instruction execution pipeline).
c)Restore the “state” of the computation assigned to the second *virtual* CPU.
d)Use your (only)*real* CPU for a few milliseconds to execute the computation that the second *virtual* CPU must do.
e)Save the “state” of the computation assigned to the second *virtual* CPU.
f)Restore the “state” of the computation assigned to the first *virtual* CPU.
g)Go back to step a).
The process described in the steps (b) & (c) is one “context switch” (The steps (e) & (f) are also one “context switch”). “Context Switching” consumes a lot of CPU resources. It can happen that 60% of the CPU computational power is used to execute “context switching”. In such situation, only the remaining 40% of the CPU resources are available to compute the data transformation graph and it will thus run very slowly.
In the ideal situation, the “Task Manager” should display a number *near* 100% of CPU-consumption (e.g. 95% or 99%). If you try to use too much CPU’s inside your graph (i.e. you try to go “above” 100% of CPU consumption), the computation speed will (most of the time) be reduced. Sometime (not very often), you’ll directly see inside the “Task Manager” that your graph is actually slowing down (i.e. the CPU-consumption will drop around 50% because of the many “starvations“). Most of the time, the computational-speed of your data-transformation-graph will decrease but it won’t be easily noticeable inside the MSWindows “Task Manager” because you’ll see a 100% CPU-consumption that might fool you (The CPU is actually busy performing many “context switching”).
Adjusting the amount of CPU used inside a graph can be tricky: We are always tempted to design our graphs to use more and more CPU’s. But, at the same time, if we try to go “above” 100% of CPU consumption, the data-transformation suddenly slows down dramatically. Finding the right settings sometime requires a small “trial-and-error” procedure to get it right. Simply “time” your transformation graph on a sample, using different settings and keep the settings with the shortest computation time.
Be warned: There is a BIG penalty-hit if you try to use more CPU’s than actually physically available inside your server. In the ideal situation, the “Task Manager” should display a number near 100% of CPU-consumption (i.e. 95% or 99%).
![]()
Why is it so bad to try to use more CPU’s than the actual number of physically available CPU’s inside your server?
One first, simple answer is that you’ll lose CPU resources in “context switching”. …but there is something even worse than that.
Let’s assume that you have a 2-CPU server and you run this graph:
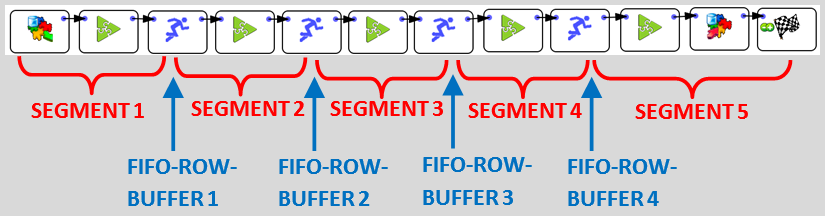
This graph is designed to use (at least) 5 CPU’s. In between each of the 5 multithread segments, there is a ![]() Multithread Action that contains a FIFO-Row-Buffer (do you remember the “water tank” of section 5.3.2.1.?).
Multithread Action that contains a FIFO-Row-Buffer (do you remember the “water tank” of section 5.3.2.1.?).
Let’s now assume that SEGMENT 5 is very fast to compute. Thus, most of the time, the FIFO-ROW-BUFFER 4 will be empty (because, as soon, as there are a few rows inside the buffer, we’ll process them all very quickly). In technical terms, SEGMENT 5 is “starving” most of the time. To give some rows to process to SEGMENT 5, we need to run SEGMENT 4 for a little while. …but we have only 2 *real* CPU’s: The MSWindow task scheduler must assign one of the 2 *real* CPU’s to SEGMENT 4. The MSWindow scheduler has no idea of the structure of your data-transformation-graph: It does not know about the dependencies that exist between the different SEGMENTS: e.g. It has no idea that, to un-block SEGMENT 5, it needs to run the SEGMENT 4 for a little while. Thus, it will choose mostly randomly one of the SEGMENTS to run. If you are lucky, it will be SEGMENT 4 and your data-transformation will “advance” a little bit further. If you are unlucky, it will choose a SEGMENT that has an input FIFO-ROW-BUFFER nearly empty: This SEGMENT will thus run for a very small amount of time (to process the small number of rows in input) and then stop (i.e. because of “starvation”: no more rows to process), forcing the MSWindow task scheduler to execute one more CPU-costly “context switch” (searching for another SEGMENT to run). This will lead to a large amount of “context switching” (searching for the “right” multithread segments to SEGMENT to “advance” the data transformation) and, at the end, you obtain a very inefficient (i.e. really slow) data transformation.
Some poorly designed Multi-CPU multithreaded Anatella graphs might run slower than their 1-CPU single threaded equivalent (it’s quite common for very small graphs, with only a few Actions). It’s also common that some Anatella graphs should not be multithreaded at all (More precisely: Any graph can be multithreaded: The question is rather: Does the multithreading makes computation faster?).
Summary: Because the MSWindow task scheduler does not know about the dependencies between the different multithread SEGMENTS inside your data transformation graph, it will lose a large amount of CPU-time in “context switching”, searching (mostly randomly) for the “right” SEGMENT to execute. This, of course, leads to very slow computing speed for your data transformation. Do not design your graph to use more CPU’s than required. Sometime, 1-CPU single-threaded execution is the fastest.