Icon: ![]()
Function: ConfidanceTest
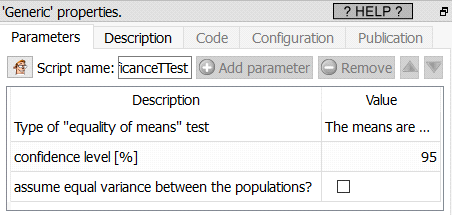
Property window:
Short description:
Compare if two means are equal.
Long Description:
We are comparing different means computed on the first population (that is described on the first row of the input table) to the means of the other populations (that are described on the subsequent rows of the input table). We thus compute several different comparisons between 2 populations. If you need to compare together more than 2 populations (to see if all their means are equal), you should rather use an ANOVA test.
The test implemented here assume a normal distribution of the variables (it's the classical Student T-test or Welch's T-test).
The output table contains:
•The "P-Value": It's the probability that the 2 means are indeed equal (or not significantly different)
•The "test OutCome": it's equal to one (true) when the test succeed (e.g. when we declare the two means equal, or not significantly different)
What's the "Confidence level"?
The probability of detecting an equality of the means (while the two means are indeed equal).
We can easily declare to have found an equality while there is actually no equality: i.e. We don't want to miss any possible equality.
When the "confidence level" increases, we accept more and more greater differences between the means, to avoid missing any positive case.
A confidence level of 95% indicates a 5% risk of concluding that a difference exists when there is no actual difference.
The most common value for the "confidence level" is 95% (0.95).
We also have this relation: "Confidence level" = 100% - "Significance Level"
Here is an example of usage:
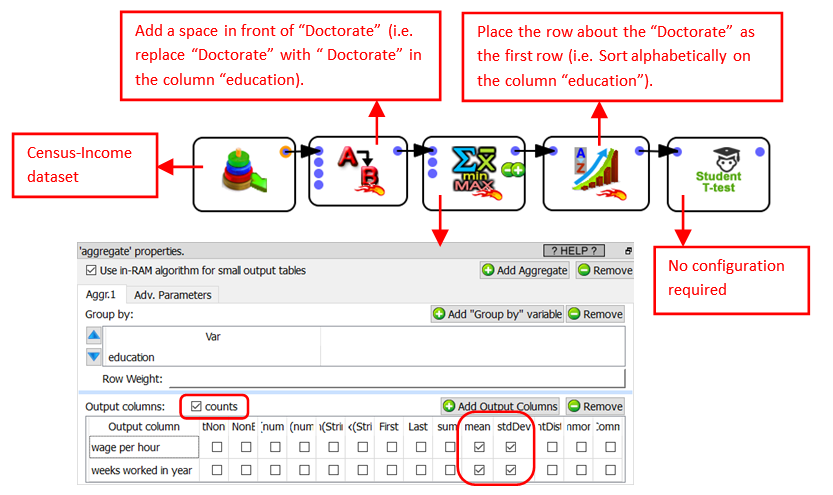
The exact output table of the ![]() student T-Test action is given on the next page.
student T-Test action is given on the next page.
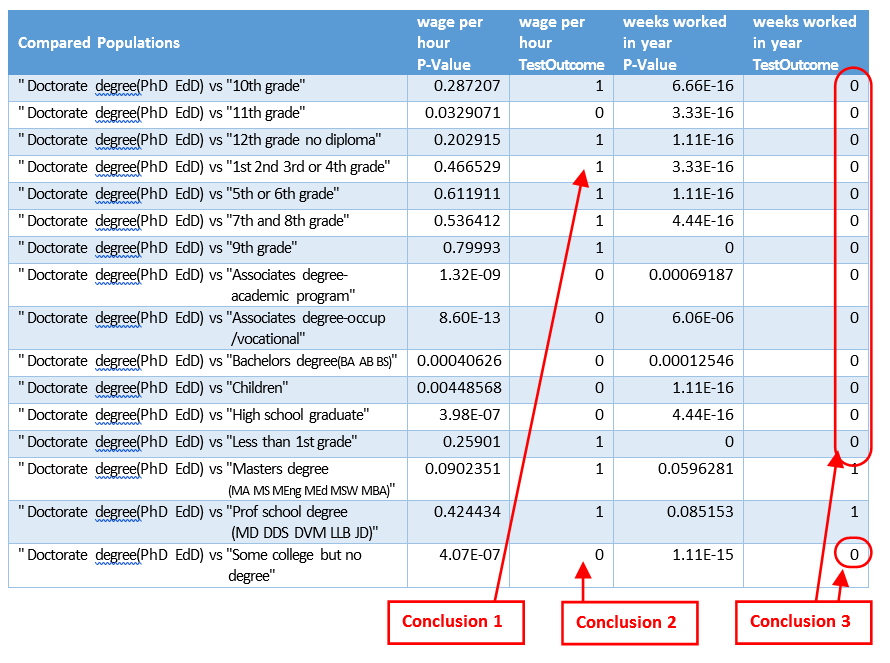
What do we see inside this output table? Here are 3 conclusions extracted from the table:
•Conclusion 1: Somebody with a doctorate won’t have some wages that are fundamentally different that somebody that only got a “First Grade Degree” (i.e. the average “wage per hour” between these 2 groups of people is not different). So, obtaining a doctorate does not seem to “pay off”?
•Conclusion 2: If you have a doctorate, your average “wage per hour” is different than somebody without any degree at all (with the expection of some basic College degree). Since these two education levels seems really different (in terms of “wage per hour”), the next question is: What’s the best degree to have between these two (in terms of “wage per hour”)? The answer might surprise you!
•Conclusion 3: Because the last column on the right is filled with plenty of zero’s, it seems the average “number of weeks worked in year” for the people with a doctorate degree is significantly different (i.e. higher) than for most of the other eduction levels. Basically, the people with a “doctorate degree” are working more than the others?