|
<< Click to Display Table of Contents >> Navigation: 5. Detailed description of the Actions > 5.12. TA - R Predictive > 5.12.9. GLM (
|
Icon: ![]()
Function: R_GLM
Property window:

Short description:
Compute Linear Model and MANOVA.
Long Description:
This node provides a combination of LM (Linear Model) and GLM (Generalized Linear Model) functionalities.
LM is used to fit linear models. It can be used to carry out regression, single stratum analysis of variance and analysis of covariance.
GLM can either compute a single model, or work as a “model factory” when the “partition by column” mode is selected.
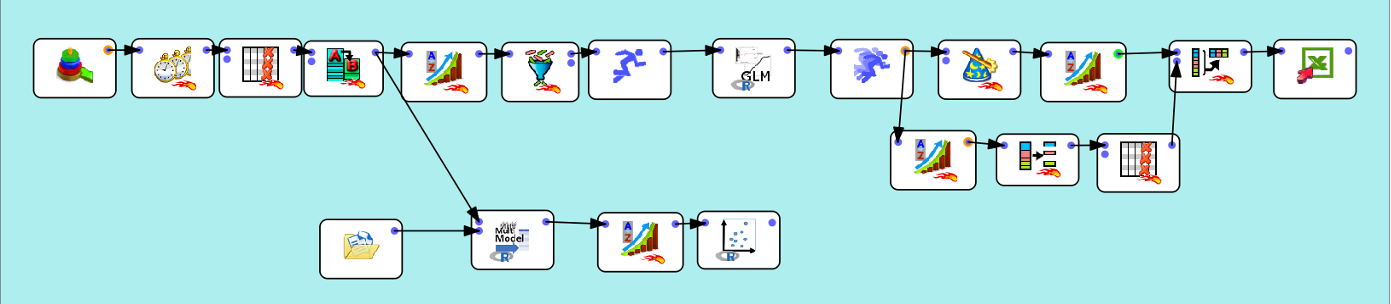
In this example, we prepare data using a “Time Travel” transformation, and we have several time series (per location, brand, segment… you name it), and we want to have one predictive model for each series, in a single operation.
We simply sort the data using the partition variable, and properly set the GLM node:
Set the “partition type” function to “Partition by Column” and select the partitioning column (in our example, “segment”). The Model name is now overwritten, and one model will be created for each value of the partitioning variable. All other functionalities remain the same. Note that you will need to use the ModelApply ![]() to score
to score
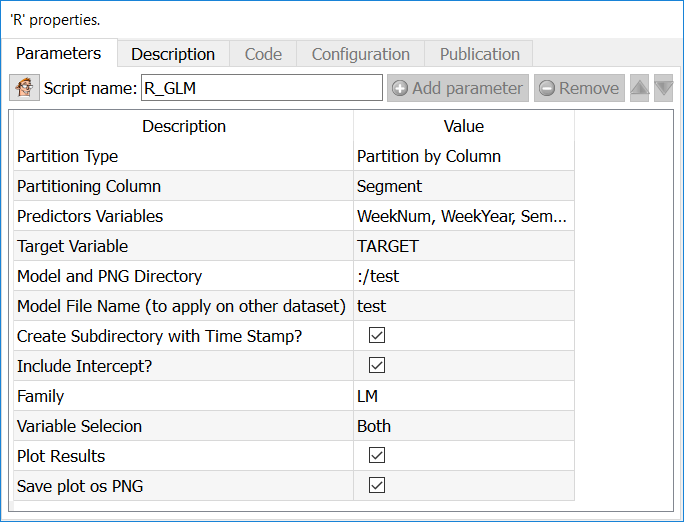
Parameters:
Predictors Variables: Select independent variables
Target Variable: Select the variable you want to predict
Model and PNG directory: Set directory in which you wish to save files
Model File Name: select the name of the rModel file in which the model is saved. If the extention is omitted, it will be set by default. This value is overwritten in case of a “partition by column”
Create Subdirectory with Time Stamp: in some cases, it is interesting to create a new directory with the time of execution of the model. This way, you can easily generate many models and compare them without adding additional nodes.
Include Intercept: try the regression with or without intercept
Family:
LM (Linear Model)
BINOMIAL
GAUSSIAN
GAMMA
INVERSE GAUSSIAN
POISSON
QUASI
Plot results: choose whether to plot the output or not
Save plot as PNG: you can automatically save the graphical output as a PNG file.
Output:
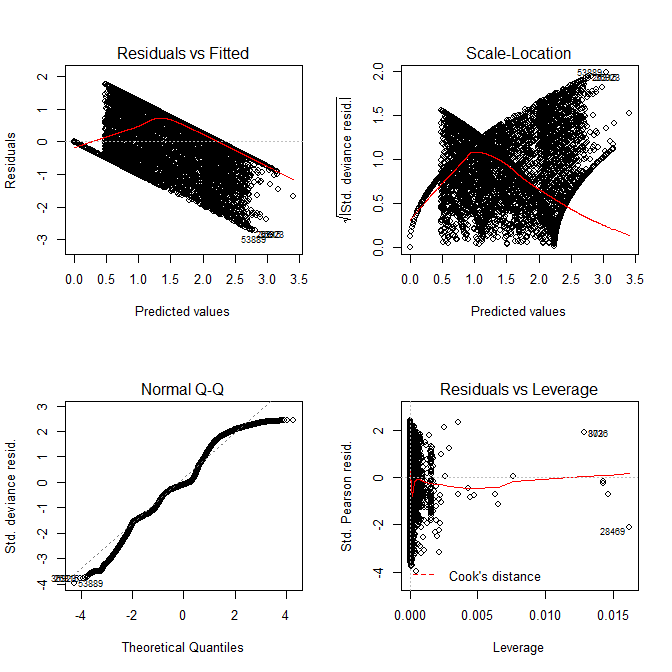
Charts:
Residual vs Fitted, Scale-Location, Normal Q-Q, Residual vs Leverage
Model output in Anatella LOG
--------------------------------------
Name of the model (Family)
--------------------------------------
Formula syntax
Coefficient (x1…xn)
Degrees of freedom
Null Deviance
Residual Deviance and AIC
ANOVA