Let’s look at the different departments in France:
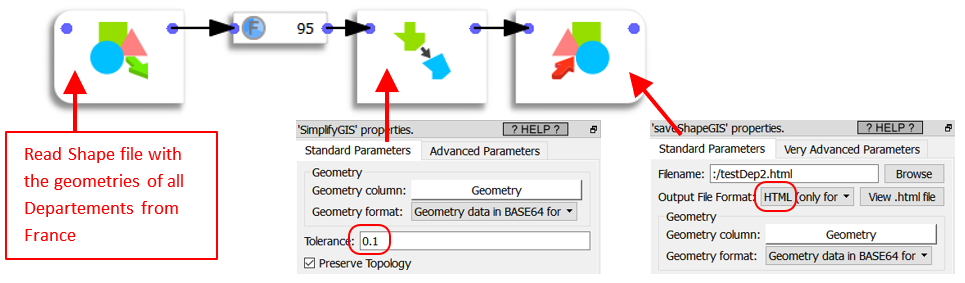
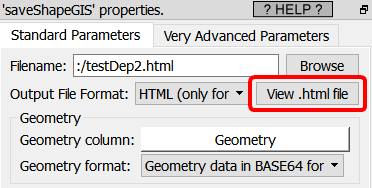
In this example, we process a shape file with 95 rows (i.e. there are 95 departments in France) and with 38 268 points (i.e. the geometry of the boundaries of each department is complex). Since this is too much points for your browser to display, we use the SimplifyGIS action (with a tolerance of 0.1 decimal degree) to reduce the total number of points to 1221 inside the geometries. Then, we run the saveShapeGIS action (i.e. right-click the saveShapeGIS box and select the ![]() “play” button) and, finally, we click on the “View .html file” button here:
“play” button) and, finally, we click on the “View .html file” button here:
We get:
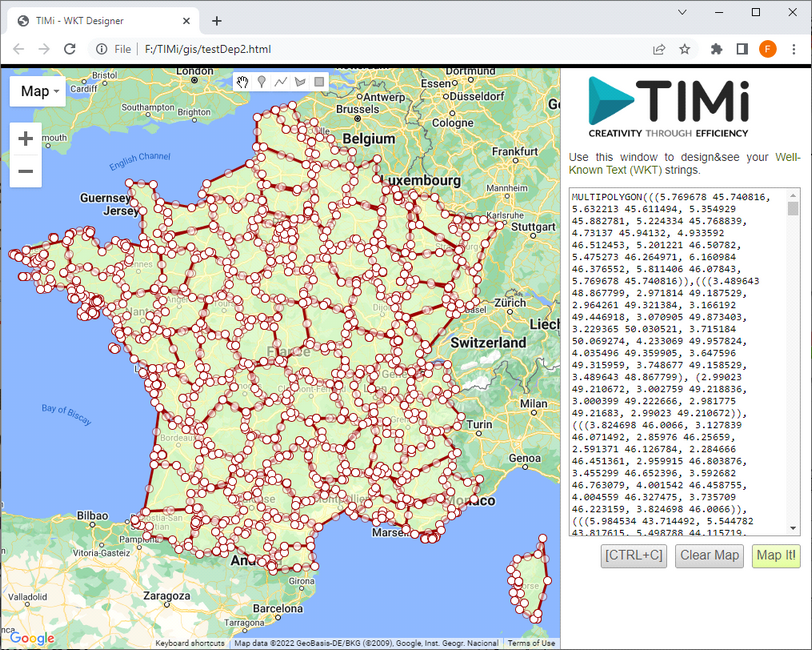
It should be noted that, in the above example, inside the simplifyGIS action, we used a tolerance of 0.1 decimal degree. Although the end result looks visually ok, it’s still better to use the simplifyGIS action in a different coordinate system (i.e. not inside the coordinate system with the 4326 SRID). For example, in the example above it would have been better to: (1) reproject the geometries inside the 2154 SRID, (2) simplify the geometries inside this better (cartesian) coordinate system and, (3) finally, reproject the geometries in the 4326 for visualization.