One Anatella feature that is really nice: When stopping the debugger, the position of your breakpoints is saved and the next time you use the debugger, you will retrieve your breakpoints exactly where you left them!
Usually, once you have detected your bug, you want to:
1.Stop the execution of the Anatella-Graph: press F4 and thereafter (possibly several times) F5.
2.Correct your bug (edit the JavaScript code)
3.Re-run the Anatella-Graph: press F5 to run your Anatella-Graph without the debugger or F6 to run with the debugger
To abort the execution of your graph, press the ![]() button (or Press F4). Unfortunately, the graph execution does not abort immediately: The Anatella Engine is only able to stop the graph execution when it’s not executing any JavaScript code. You must thus exit the JavaScript code (and return to the C/C++ code) to allow Anatella to stop the graph execution. The simplest way to exit the JavaScript code execution is to press (possibly several times) F5: This will Continue
button (or Press F4). Unfortunately, the graph execution does not abort immediately: The Anatella Engine is only able to stop the graph execution when it’s not executing any JavaScript code. You must thus exit the JavaScript code (and return to the C/C++ code) to allow Anatella to stop the graph execution. The simplest way to exit the JavaScript code execution is to press (possibly several times) F5: This will Continue ![]() the JavaScript code execution up-to-the-point that the execution control goes back to C/C++ code: At that precise moment, Anatella is able to completely abort the graph execution.
the JavaScript code execution up-to-the-point that the execution control goes back to C/C++ code: At that precise moment, Anatella is able to completely abort the graph execution.
Once the graph execution is completely stopped, you will see inside the Anatella log window the message “Run has been stopped unexpectedly!”. For example:
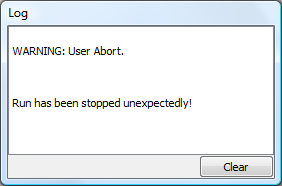
Once you see this message, you can be sure that the graph execution is successfully aborted (but not before).
To summarize: To stop the debugger: press F4 and thereafter (possibly several times) F5.
Thereafter, to re-run your graph (in debug-mode), press F6.