|
<< Click to Display Table of Contents >> Navigation: 5. Detailed description of the Actions > 5.7. Data Mining > 5.7.10. Vectorized Calculator (High-Speed
|
Icon: ![]()
Function: CalculatorVectorized
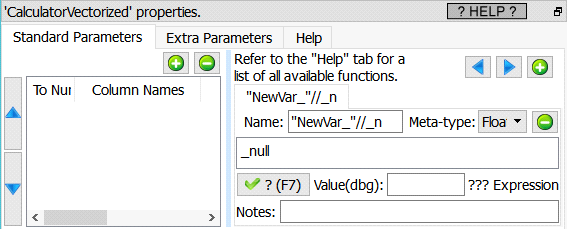
Property window:
Short description:
Compute many new columns easily.
Long Description:
The first step before creating a predictive model is to build a learning dataset that contains as many “good” features as possible (this is named “feature engineering”). For example, in telecom, if you want to predict if a subscriber will renew its subscription the next month (i.e. if you want to do a “churn” model), it’s interesting to look at the consumptions patterns of the previous months (i.e. to look at the Month “M-1”, “M-2” and also maybe “M-3”). This means that you’ll have a learning dataset that will include features such as:
•Month_M-1_Number_of_Voice_Calls
•Month_M-2_Number_of_Voice_Calls
•Month_M-1_Number_of_SMS
•Month_M-2_Number_of_SMS
•Month_M-1_Total_Duration_of_Voice_Calls
•Month_M-2_Total_Duration_of_Voice_Calls
•Month_M-1_Numbers_of_International_Calls
•Month_M-2_Numbers_of_International_Calls
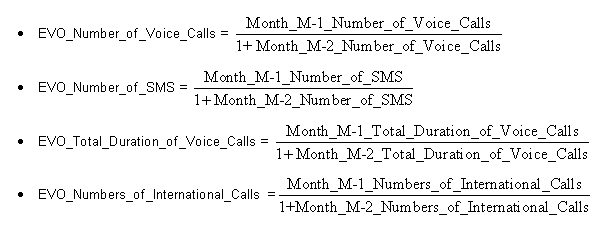
The above 8 features are interesting in themselves but there exist some even better, more meaningful features: These features are named the “Evolution” features and represents the evolution over time of the “original, raw” features. Here are 4 “Evolution” features that are based on the list of 8 features shown here above:
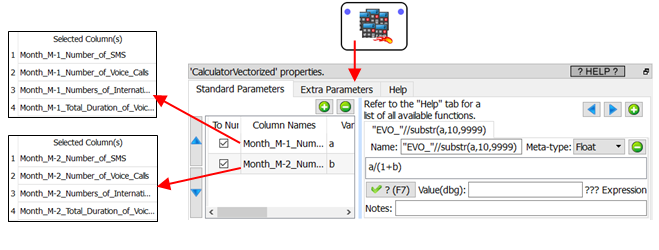
One of the (many) objective of the ![]() Vectorized Calculator Action is to allow you to quickly create thousands of “Evolution” features. For example, to create the 4 “EVO_*” features shown here above, we’ll have:
Vectorized Calculator Action is to allow you to quickly create thousands of “Evolution” features. For example, to create the 4 “EVO_*” features shown here above, we’ll have:
About the above example:
•The equation that is used to compute the “Evolution” variables is “a/(1+b)” but many other variations exist: For example: “a-b”, “b?a/b:0”, “2*a/(b+c)”, etc.
•We created 4 new “Evolution” variables/columns. In most “real-life” examples, the ![]() Vectorized Calculator Action is rather used to create between 100 and 1000 new variables/columns.
Vectorized Calculator Action is rather used to create between 100 and 1000 new variables/columns.
The different variables declared in the left panel of the ![]() Vectorized Calculator Action (in the above example: the variables “a” and “b”) can either be:
Vectorized Calculator Action (in the above example: the variables “a” and “b”) can either be:
•A list of several columns. All the list that are declared must have the same size. In the example above, the list size is “4”, and there are two lists (“a” and “b”):
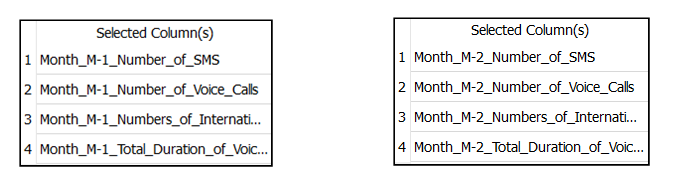
The procedure to create each of these 2 list is quite simple too: For example, to create the “a” list:
oOpen the “column chooser” Window
oEnter “m-1” inside the “filter” box: ![]()
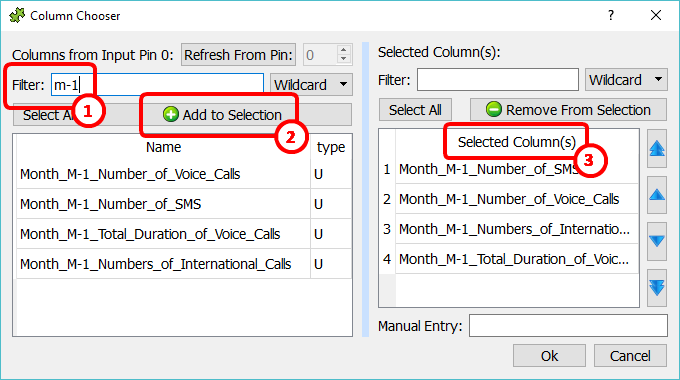
oClick the “Add to selection” button ![]()
oSort the selected columns by clicking on the header of the list, here: ![]()
This last “sort” step is required to ensure the consistency between all the different lists (between the “a” and “b” list), to be sure that the variables/columns are all in the same order in all the lists.
•One unique column.
Here is second example (demonstrating the “one unique column” option):
We start with a table that contains the sales of the 12 months of the year (in absolute value):
Sales_January |
Sales_February |
Sales_March |
Sales_April |
Sales_May |
Sales_June |
Sales_July |
Sales_August |
Sales_September |
Sales_October |
Sales_November |
Sales_December |
20 |
40 |
80 |
30 |
70 |
90 |
80 |
70 |
20 |
30 |
20 |
10 |
…and we want to convert all these “absolute values” to some percentage.
To arrive to the solution to this small problem, we need two steps:
•Compute the sum of all the sales for the whole year (using the ![]() AggregateOnColumns Action)
AggregateOnColumns Action)
•Compute the actual percentages (using the ![]() Vectorized Calculator Action)
Vectorized Calculator Action)
More precisely, we have:
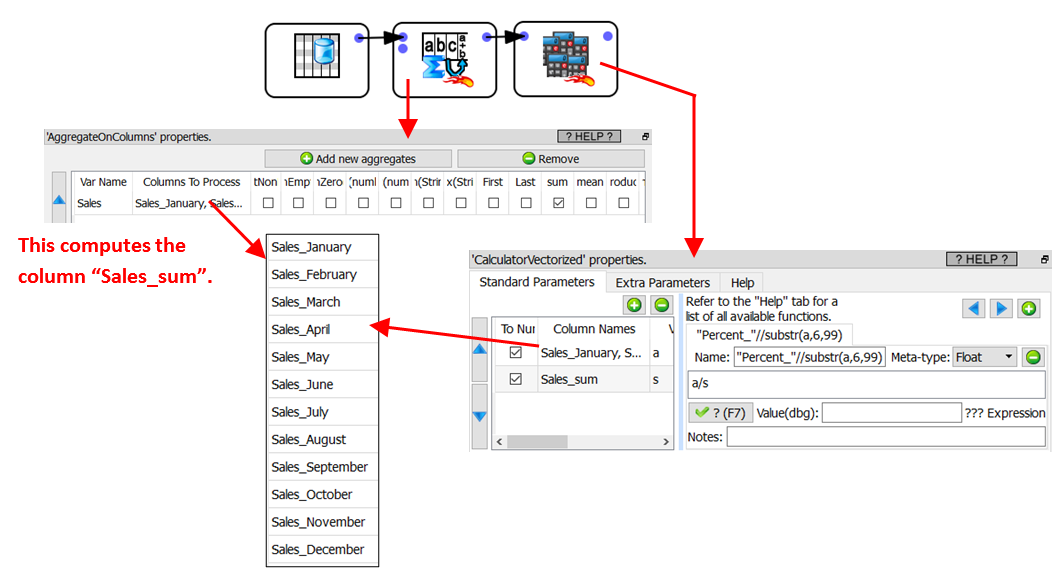
In the above example, the ![]() Vectorized Calculator Action adds these columns to the final, result table:
Vectorized Calculator Action adds these columns to the final, result table:
Percent_January |
Percent_February |
Percent_March |
Percent_April |
Percent_May |
Percent_June |
Percent_July |
Percent_August |
Percent_September |
Percent_October |
Percent_November |
Percent_December |
3.57143 |
7.14286 |
14.2857 |
5.35714 |
12.5 |
16.0714 |
14.2857 |
12.5 |
3.57143 |
5.35714 |
3.57143 |
1.78571 |