Icon: ![]()
Function: LineEst
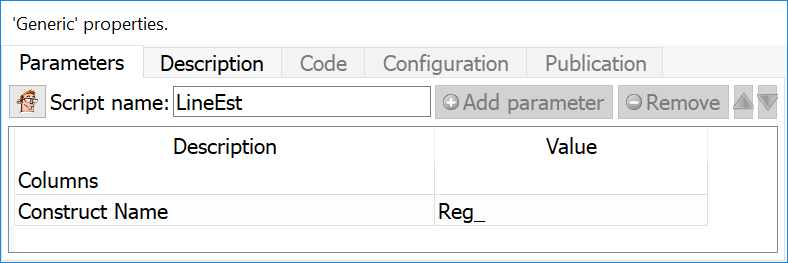
Property window:
Short description:
Compute a linear regression, row-by-row.
Long Description:
Compute a linear regression by row, when each column corresponds to an equal interval of time. When working with time series, this is often a very useful transformation as it allows to compute the trend overtime at a row level.
Typically, we compute: trend at 3,6,12 and 24 months. The LineEst note output consists of two variables: Beta 0 and Beta 1. Those variables are also useful inputs of segmentation, much easier to deal with than original purchase history.