|
<< Click to Display Table of Contents >> Navigation: 5. Detailed description of the Actions > 5.13. TA - R_Discovery Analytics > 5.13.1. PCA (
|
Icon: ![]()
Function: R_PCA
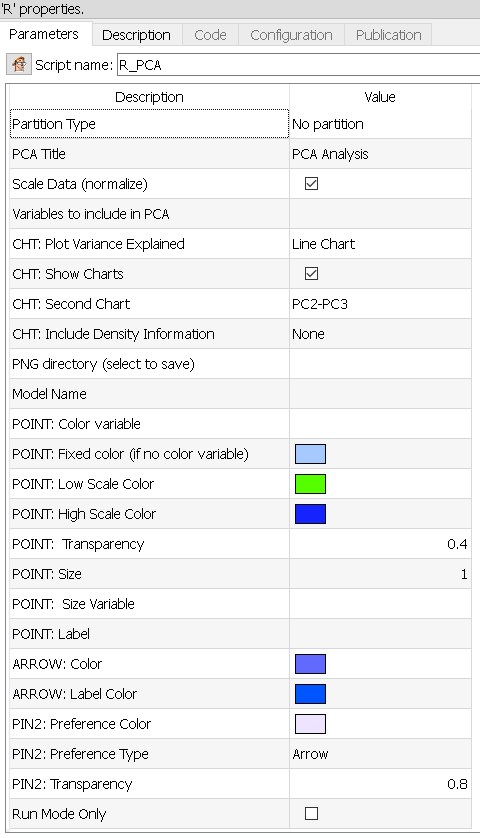
Property window:
Short description:
Compute the PCA.
Long Description:
Principal Component Analysis is a data reduction technique that extract the linear components which are underlying a selection of variables. This action uses the prcomp command of the R Stat Library.
Simply select the variables you wich to include, and the recoded columns will be added as new columns.
The tables in input are:
•Pin 0: data table
•Pin 1: Variable Names
•Pin 2: Optional Preference Data
The tables in output are:
•pin 0: intput data matrix represented in the new coordinate system composed of the eigen vectors
•pin 1: eigen vectors inside the orignal coordinate system
•pin 2: eigen values
Parameters:
PCA Title: Title of the chart.
Variables to include in PCA: select the list of variables. Remember that if you have a few independent variables, those will add noise in your PCA. Some manual selection is always needed.
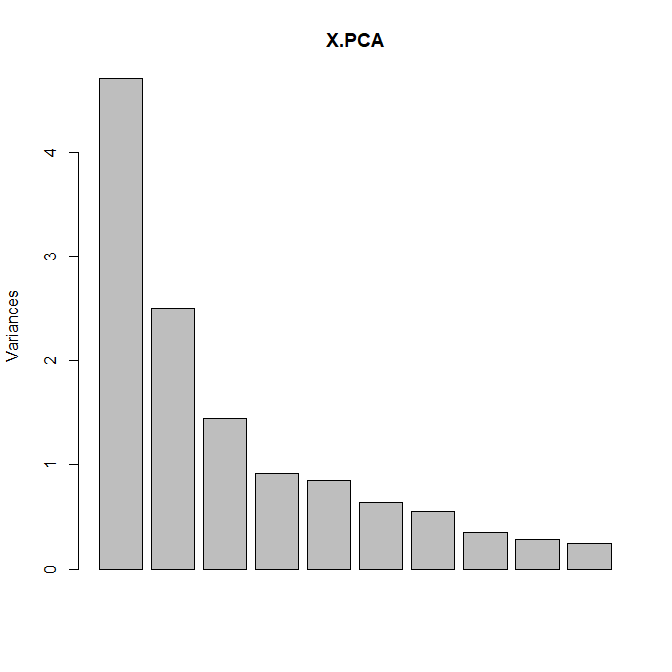
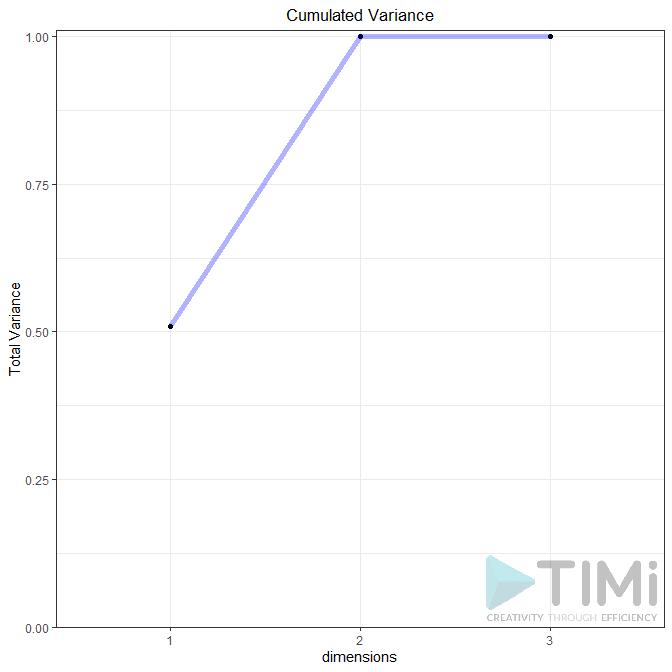
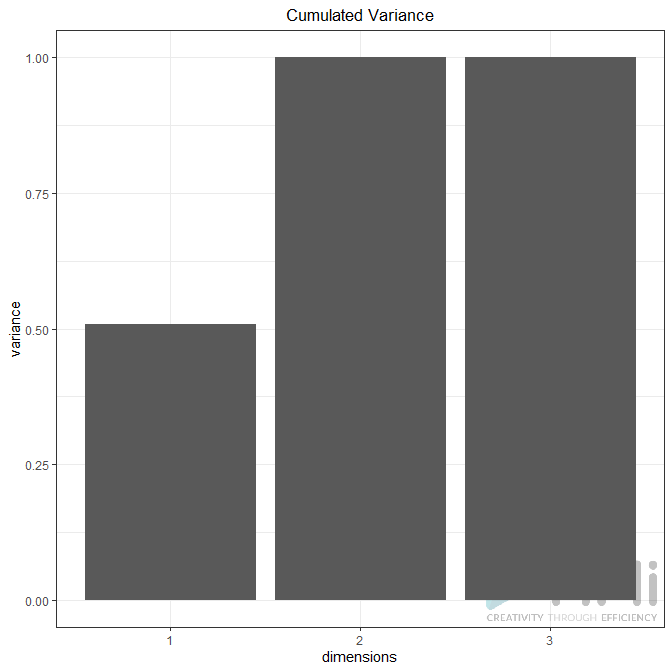
Plot Variance Explained: None, Line Plot or Bar Plot (the example below shows both plot)
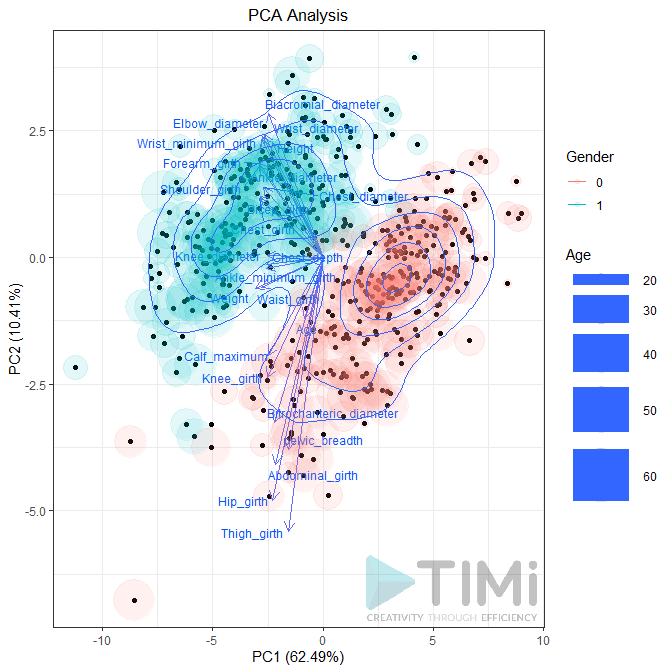
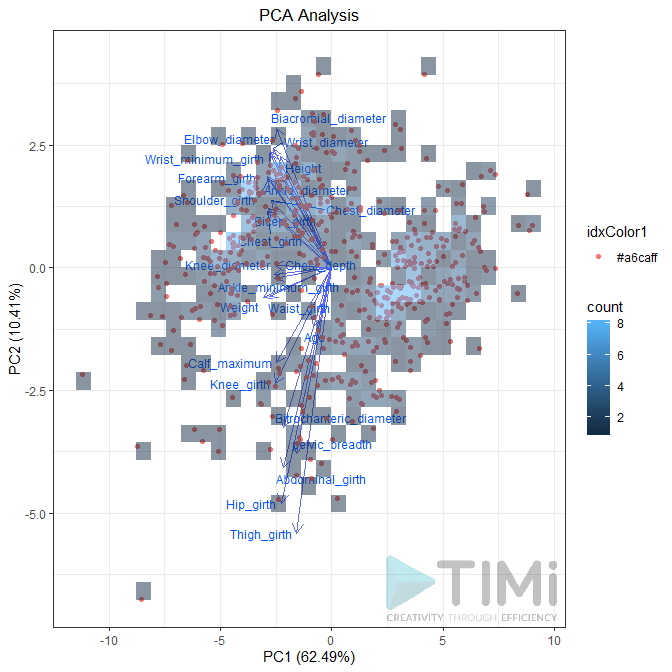
Biplot (true / false): Plots the first two dimensions. Observations are light dots, variables dark blue. The density can be represented in “2D density” (left plot) or BIN (right plot). As displayed below, you can set many options to play with point size, transparency, add label, add density, etc.
Preferences: if the second pin is connected, the PCA will be applied to this dataset. You can choose to plot it as point or as vector. In each case, you can set the transparency (between 0 and 1).