|
<< Click to Display Table of Contents >> Navigation: 5. Detailed description of the Actions > 5.12. TA - R Predictive > 5.12.10. CHAID (
|
Icon: 
Function: CHAID
Property window:
Short description:
Create a CHAID Model.
Long Description:
The CHAID (CHi-squared Automated Interaction Detection) algorithm is included in Anatella mainly because:
•…of historical reasons. The CHAID algorithm is a legacy of the early days of research in machine learning around the subject of “automatic creation of classification trees”. Since the ‘90, the researchers in machine learning have created many newer&better algorithms to create “better” tree’s than ones created with the CHAID algorithm (i.e. trees with higher AUC, and higher accuracy than the ones created with CHAID). Chronologically, the algorithms are as follow: CHAID (the oldest and the worst one), ID3, C45, C50, CART (the newest). This is obviously a non-limitative list. Nowadays, nobody uses a single tree as a classification algorithm (mainly because predictive models based on a single tree are too unreliable because they degrade too quickly over time). If you want to use some kind of “tree” algorithm, you’d rather use “Forest of Trees”, or even better, “Forest of Stumps” (Stumps are “small trees” limited to, typically, maximum 3 “levels deep”). Such algorithms are available in sections 5.12.4 and 5.12.5.
•…it can be useful for explanatory/teaching purposes.
•…it’s still probably one of the most widely used tree algorithm in marketing and market research (despite his very poor results as a classification algorithm). Indeed, if your objective is an explanatory objective (i.e. you want discover and explain SMALL datasets), CHAID can maybe be a useful algorithm.
The CHAID (CHi-squared Automated Interaction Detection) algorithm is Chi-square based, meaning that it uses a statistical significance test to decide if it’s worth proceeding with an additional cut in one of the nodes. Since CHAID is based on a Chi-square significance test, it won’t work on large samples, with more than 1000 rows (since such significance tests are useless on large datasets). The way it proceeds is comparing the two groups that would be formed, and decide if there is a statistically significant difference between the two groups. As the groups become “too small”, the confidence interval increases and eventually the cuts will not be worthwhile anymore. CHAID also offers the neat functionality of doing multiple cuts per level (not just binary).
One additional limitation of CHAID (it’s a very old algorithm) is that all the variables must be CATEGORICAL (in R: Factors), so you may want to reduce the number of categories using binning functionalities (make small groups based on cut-offs) using such an Anatella graph:
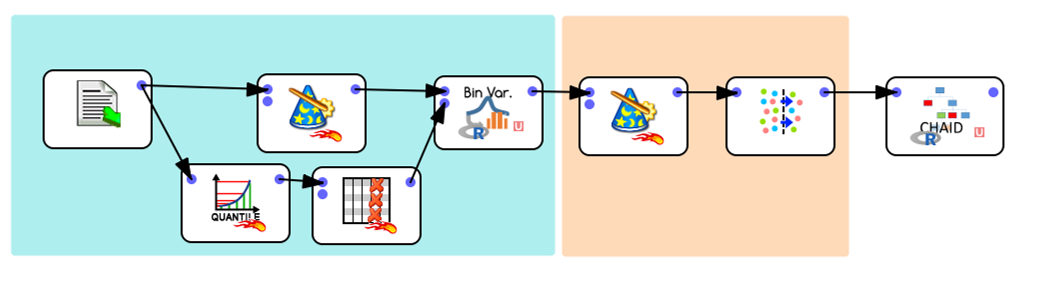
Because of this limitation, CHAID requires a few transformations before we can use it:
0-Balance the dataset between categories (aim for roughly the same proportions)
1-Recode variables based on “Clever Quantile”. This first operation also requires that the data be set to numerical, and only the “Clever Quantile” results are selected from the bottom transformation
2-Transform the recoded variables to TEXT, and select a sample (because CHAID is relly not designed for populations)
3-Run CHAID
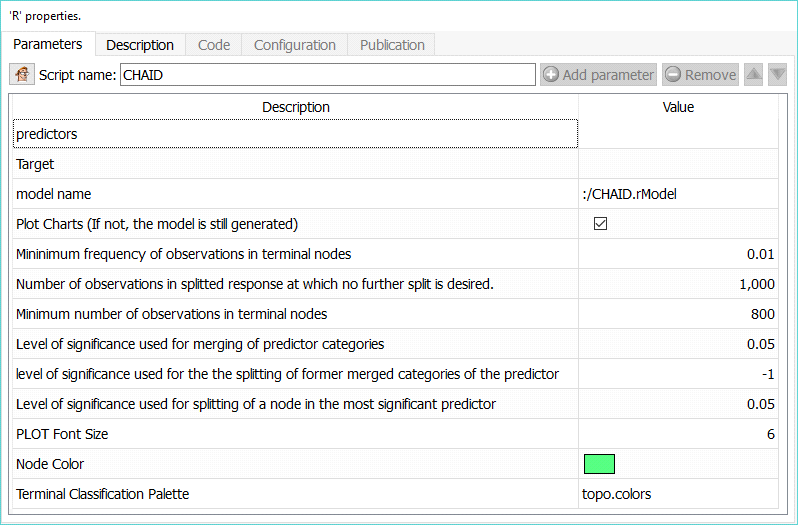
CHAID’s Parameters:
List of Predictors: Select independent variables
Target: Select the variable you want to predict
Model Output: Set the file name for the model results
Plot charts: Plot the tree
Mininimum frequency of observations in terminal nodes: percentage of the dataset in end node
Number of observations in splitted response at which no further split is desired: self explanatory
Minimum number of observations in terminal nodes: Criteria to decide whether to proceed with a cut or not.
The following options should typically not be changed:
Level of significance used for merging of predictor categories
level of significance used for the the splitting of former merged categories of the predictor
PLOT Font Size: 0 is automatic size
The other parameters can usually be left “as is”, refer to the R documentation for further information.
Other reasons why CHAID is seldom used:
•it requires a lot of efforts to prepare data,
•it will not work well with large amount of data (datasets with more than 1000 rows),
•it does not like numbers.
Basically, it is not a good algorithm for predictive modeling on real data.
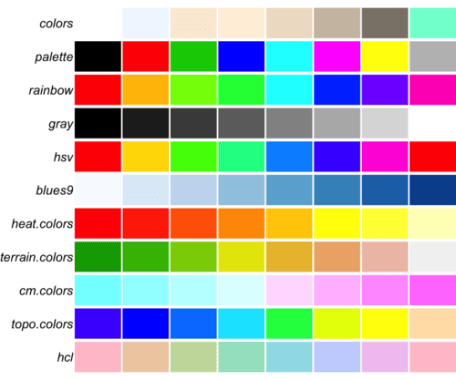
For the final node, we are using the following color options:
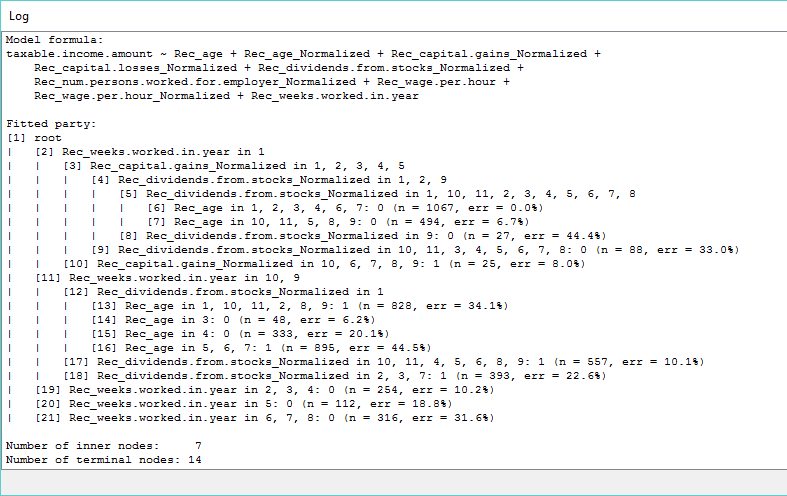
The CHAID tree is fairly easy to understand: At each node, we see a split with details of the criterion:
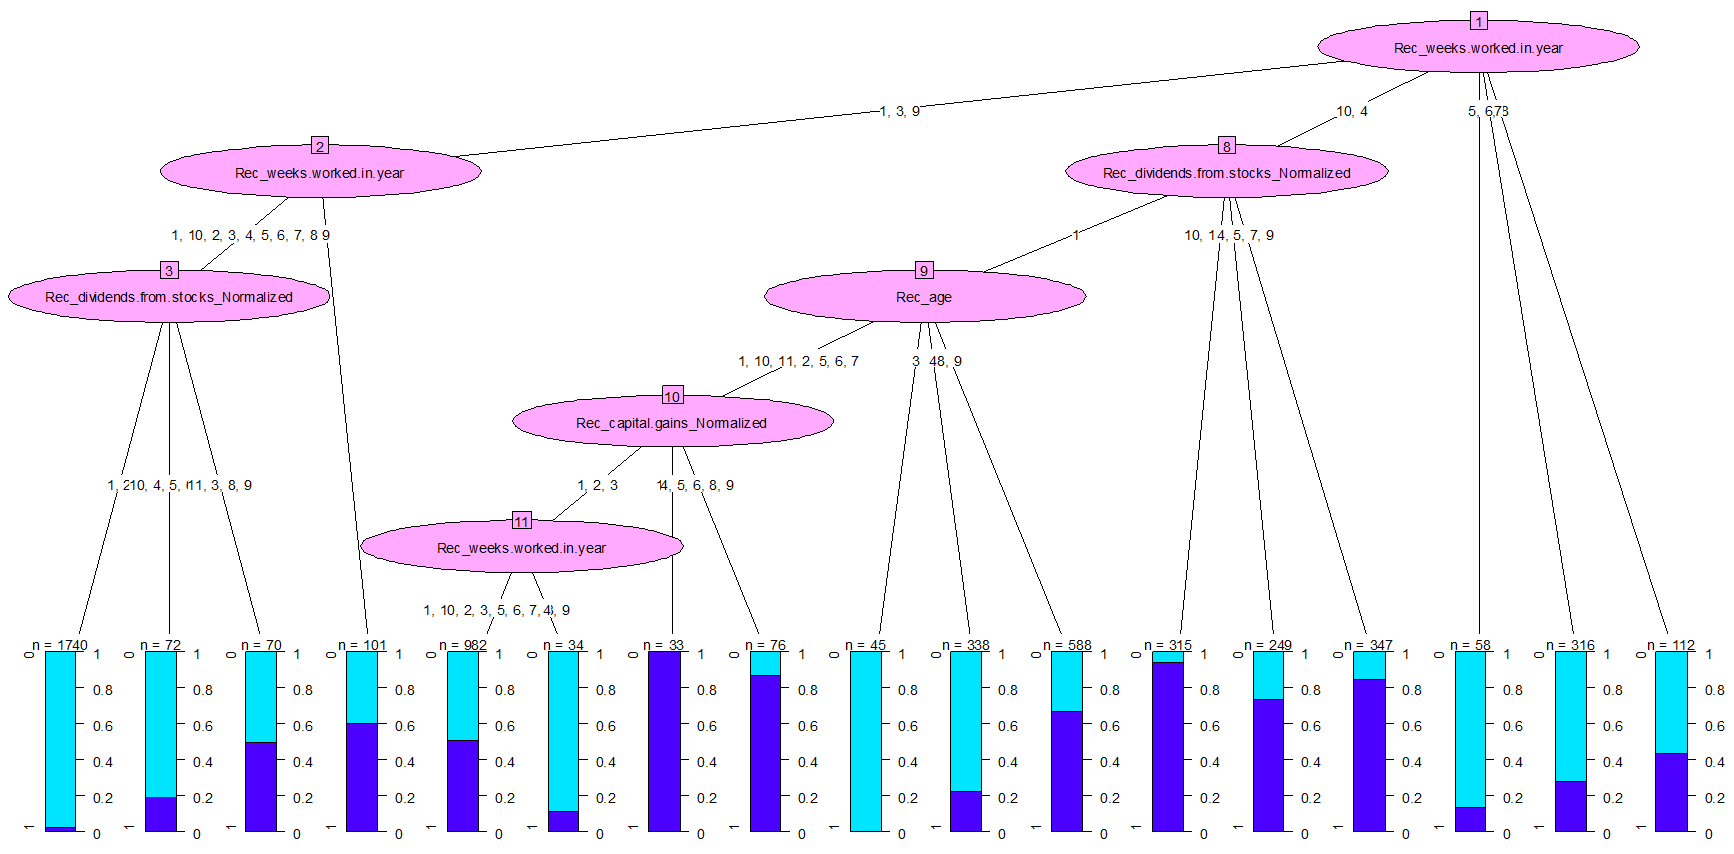
In the log window, you will also see this same information, but in text (remember to set the “fixed width” parameter in the Edit menu for a nicer display)