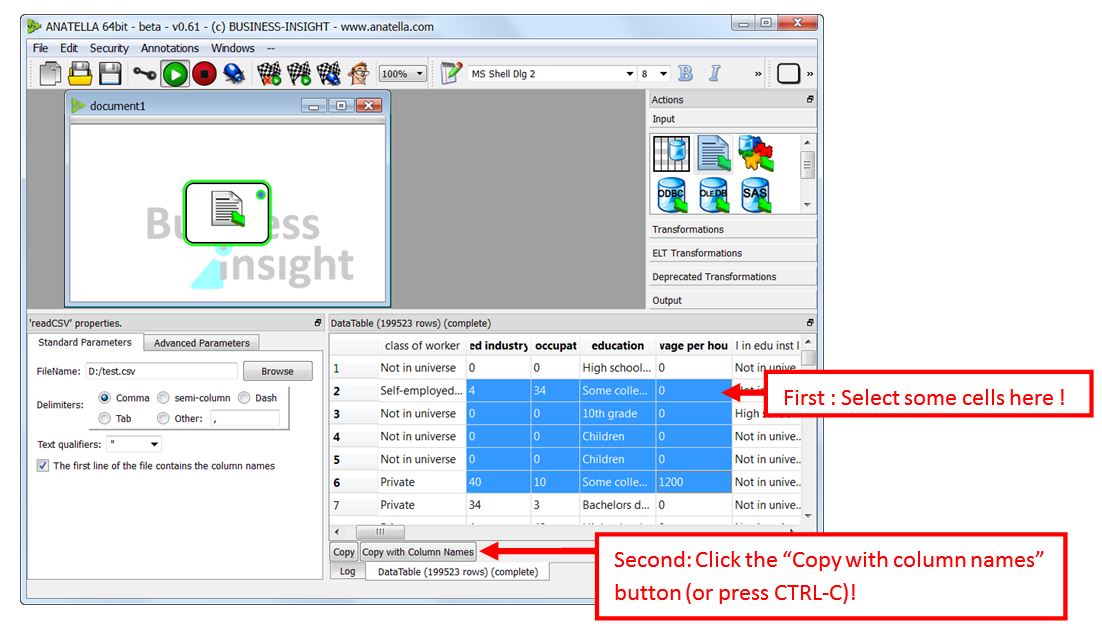
You can copy-paste the results that are inside the “Data-Preview-Table” into Excel. For example:
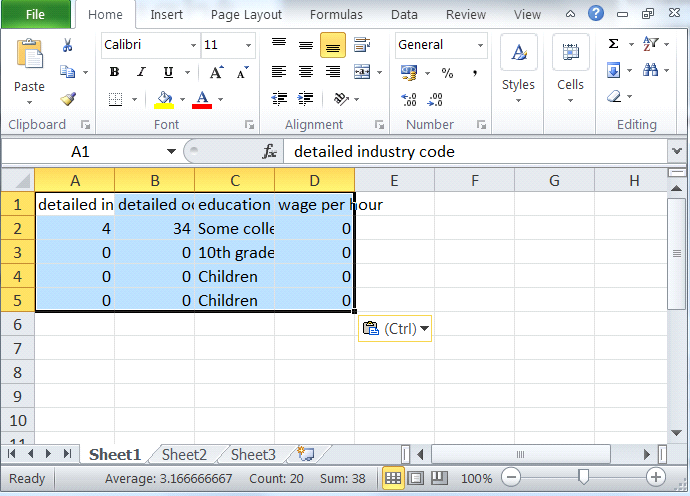
Open Excel and paste the results: (Press CTRL-V): You obtain:
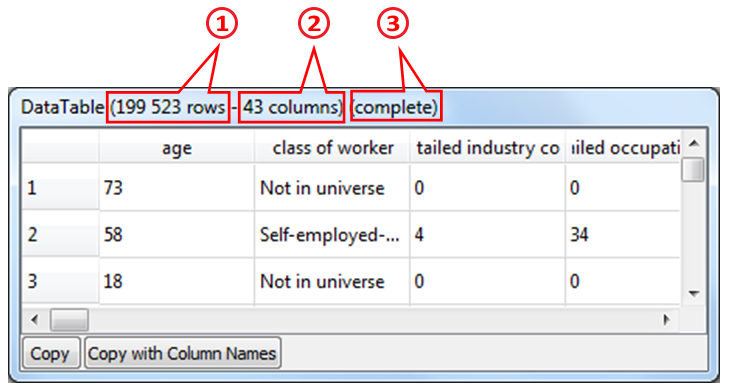
The Header of the “Data-Preview” table contains:
•The number of rows inside the table at this output pin. ![]()
•The number of columns inside the table at this output pin. ![]()
•The status of the output table and the status of the view. ![]()
This status can be:
o“Complete”: The table at this output pin has been completely computed (it will thus been used to accelerate further computations along this data flow: See section 4.2.6. for more information about this subject) and the current “Data-Preview” window is able to directly show you the complete result table.
o“Complete (partial view)”: The table at this output pin has been completely computed but only a partical view of this table is visible because the table is too big to show in its entirety.
o“Fragment”: Only a fragment (i.e. the first few rows) of the table at this output pin has been computed (typically because the user clicked the STOP button ![]() on the toolbar to abort the computations before completion). This fragment is now visible inside the “Data-Preview”. An incomplete table cannot be used to accelerate the computations later-on.
on the toolbar to abort the computations before completion). This fragment is now visible inside the “Data-Preview”. An incomplete table cannot be used to accelerate the computations later-on.
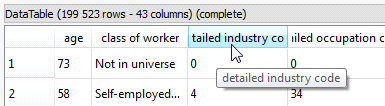
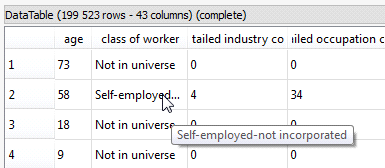
You can “hover” with your mouse above a cell (or above a column-title) to see the complete cell (or to see the complete title). For example:
You can quickly obtain a “Data-Preview” of the data at any point inside your Anatella-Data-Transformation-Graph (there is one exception: see section 5.26.2.). To know how to create and use “Data-Previews”, see the section 4.2.6. The “Data-Preview” window is thus a great tool to:
•check for data quality issues.
•check if you correctly parametrized your Actions.
•check if “everything goes as expected” in general.
The “Data-Preview” allows you to visually inspect row-by-row all your tables but, sometimes, this is not enough: You want to have a visual summary of the content of a column (just to be sure this column does not contain a small quantity of absurd values). You can easily get this summary by right-clicking the header of a column: For example, when I right-click the header of the column “Age”, I obtain:
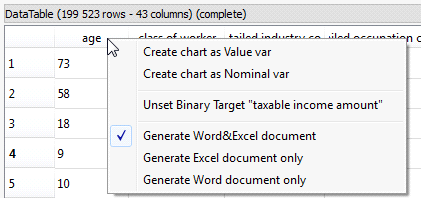
When I select inside the above context menu the option “Create Chart as Value var”, I obtain a new window:
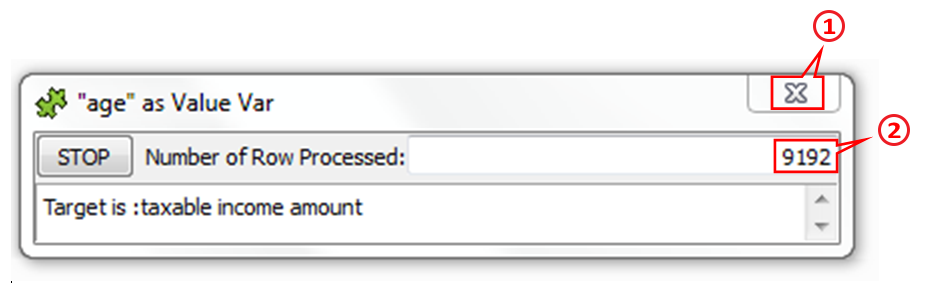
From this point, I can either:
1.Completely abort the chart computation: Click the ![]() button.
button. ![]()
2.Click the “STOP” button to compute the charts on the rows that have already been processed. The quantity of rows already processed is displayed here:![]()
3.Simply wait for the complete table to be processed.
To start a new “chart computation”, you don’t need to wait for the complete table to be computed (i.e. you don’t need to wait for the data-preview status to reach “Complete”): You can directly start the computations while the status is still on “Fragment”. This allows you to quickly produce some charts on the first few rows of your table: No need to wait! ![]()
The charts are produced as MS-Word and/or MS-Excel documents.
Here is an example on the classical “census-income” database. Let’s assume that:
•we defined as “Binary Target” the column “Taxable Income Amount”.
•we asked to see the column “age” as a Value variable.
Then, we obtain:
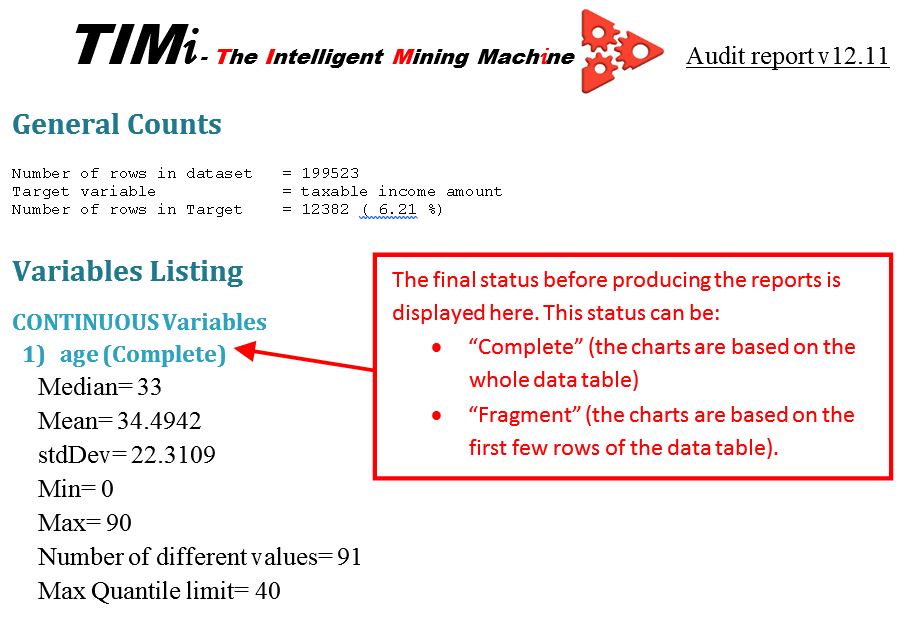
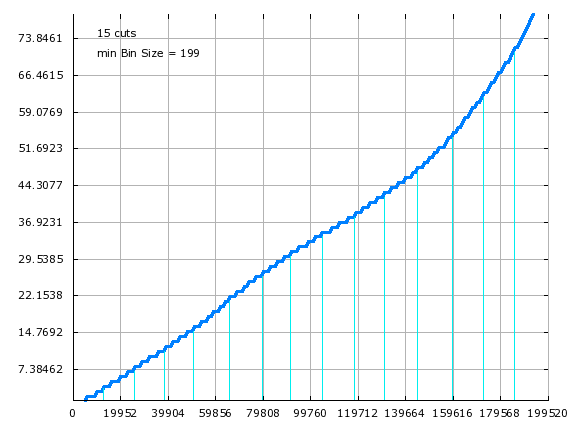
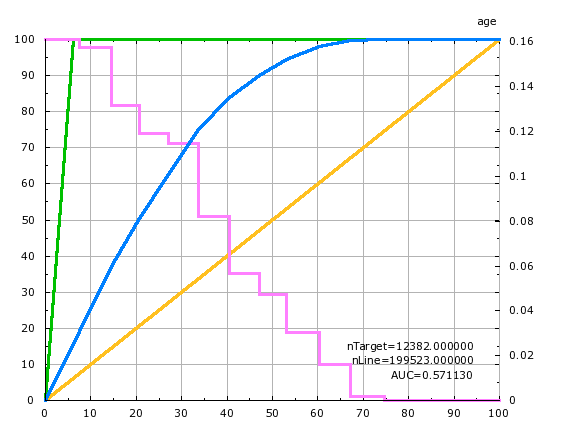
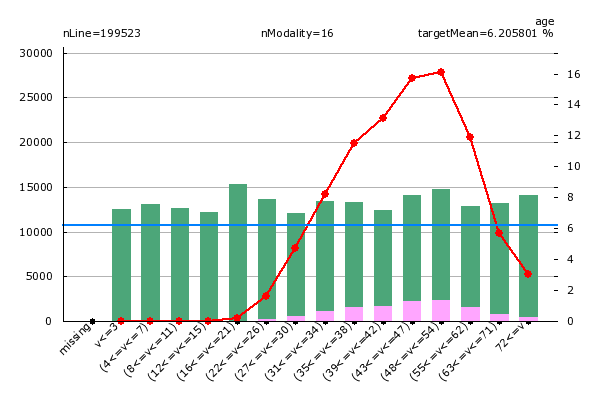
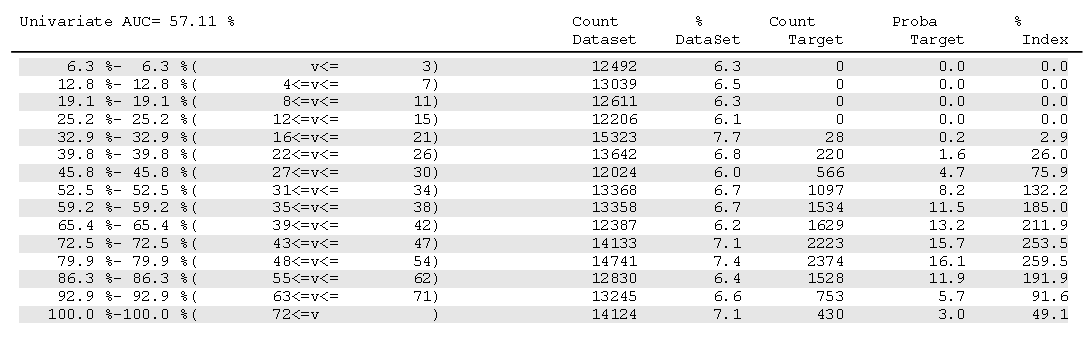
Please refer to the “TIMiQuickUserGuide.pdf” for more information about the charts displayed inside this summary report.